

How to draw isodose curve from the MCNP program?
What is an isodose curve?
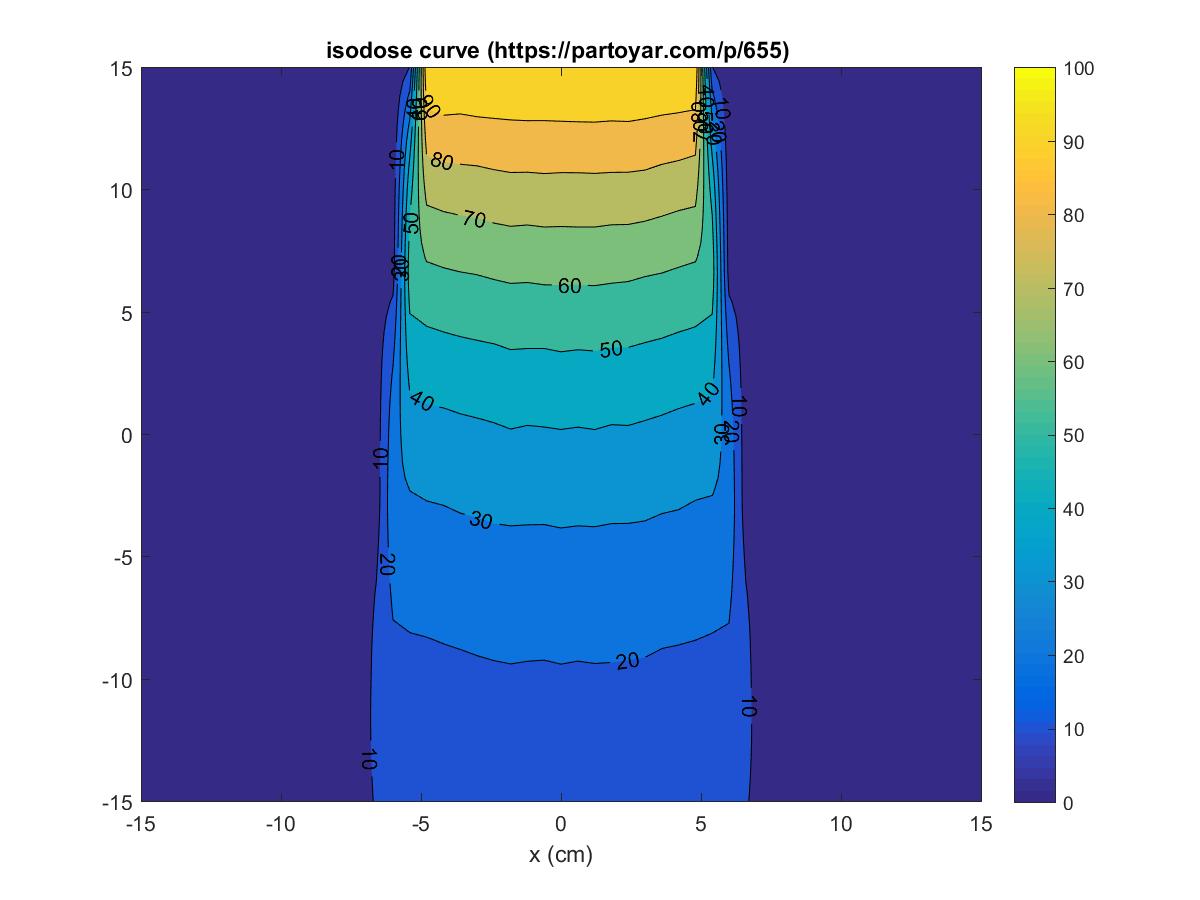
An isodose diagram for a given beam consists of a family of isodose curves, usually plotted with an increasing depth dose percentage. It shows the change in dose as a function of depth and distance from the central axis.
Isodose diagrams are used in radiation therapy to represent the dose distribution within a given volume. These diagrams consist of isodose curves, which are lines that connect points receiving the same dose of radiation. Here's a brief overview:
Key Points
-
Definition: Isodose curves represent levels of absorbed dose similar to isotherms representing temperature.
-
Purpose: They help visualize the dose distribution within a patient or phantom, ensuring that the target area receives the prescribed dose while minimizing exposure to surrounding healthy tissues.
-
Representation: Curves are typically drawn at regular intervals of absorbed dose (e.g., 100%, 90%, 80%, etc.).
-
Applications: Used in treatment planning to optimize radiation delivery and verify that the treatment plan meets the desired dose distribution
Table of Contents
Video tutorial for written programs
Output images
Image obtained from the MCNP program
File in the attachment
1) Program is written in MCNP as an example including mesh Tally
2) The program is written in MATLAB to draw the diagrams
3) Sample output from mesh Tally